
What is the Sales Attribution Report?
This article explains the purpose of the Sales Attribution Report in Ignite. The Sales Attribution Report helps you connect online shopper activity with actual vehicle sales, giving you a clear picture of how digital engagement drives dealership results.
Watch this video tutorial to see the Sales Attribution Report in action:
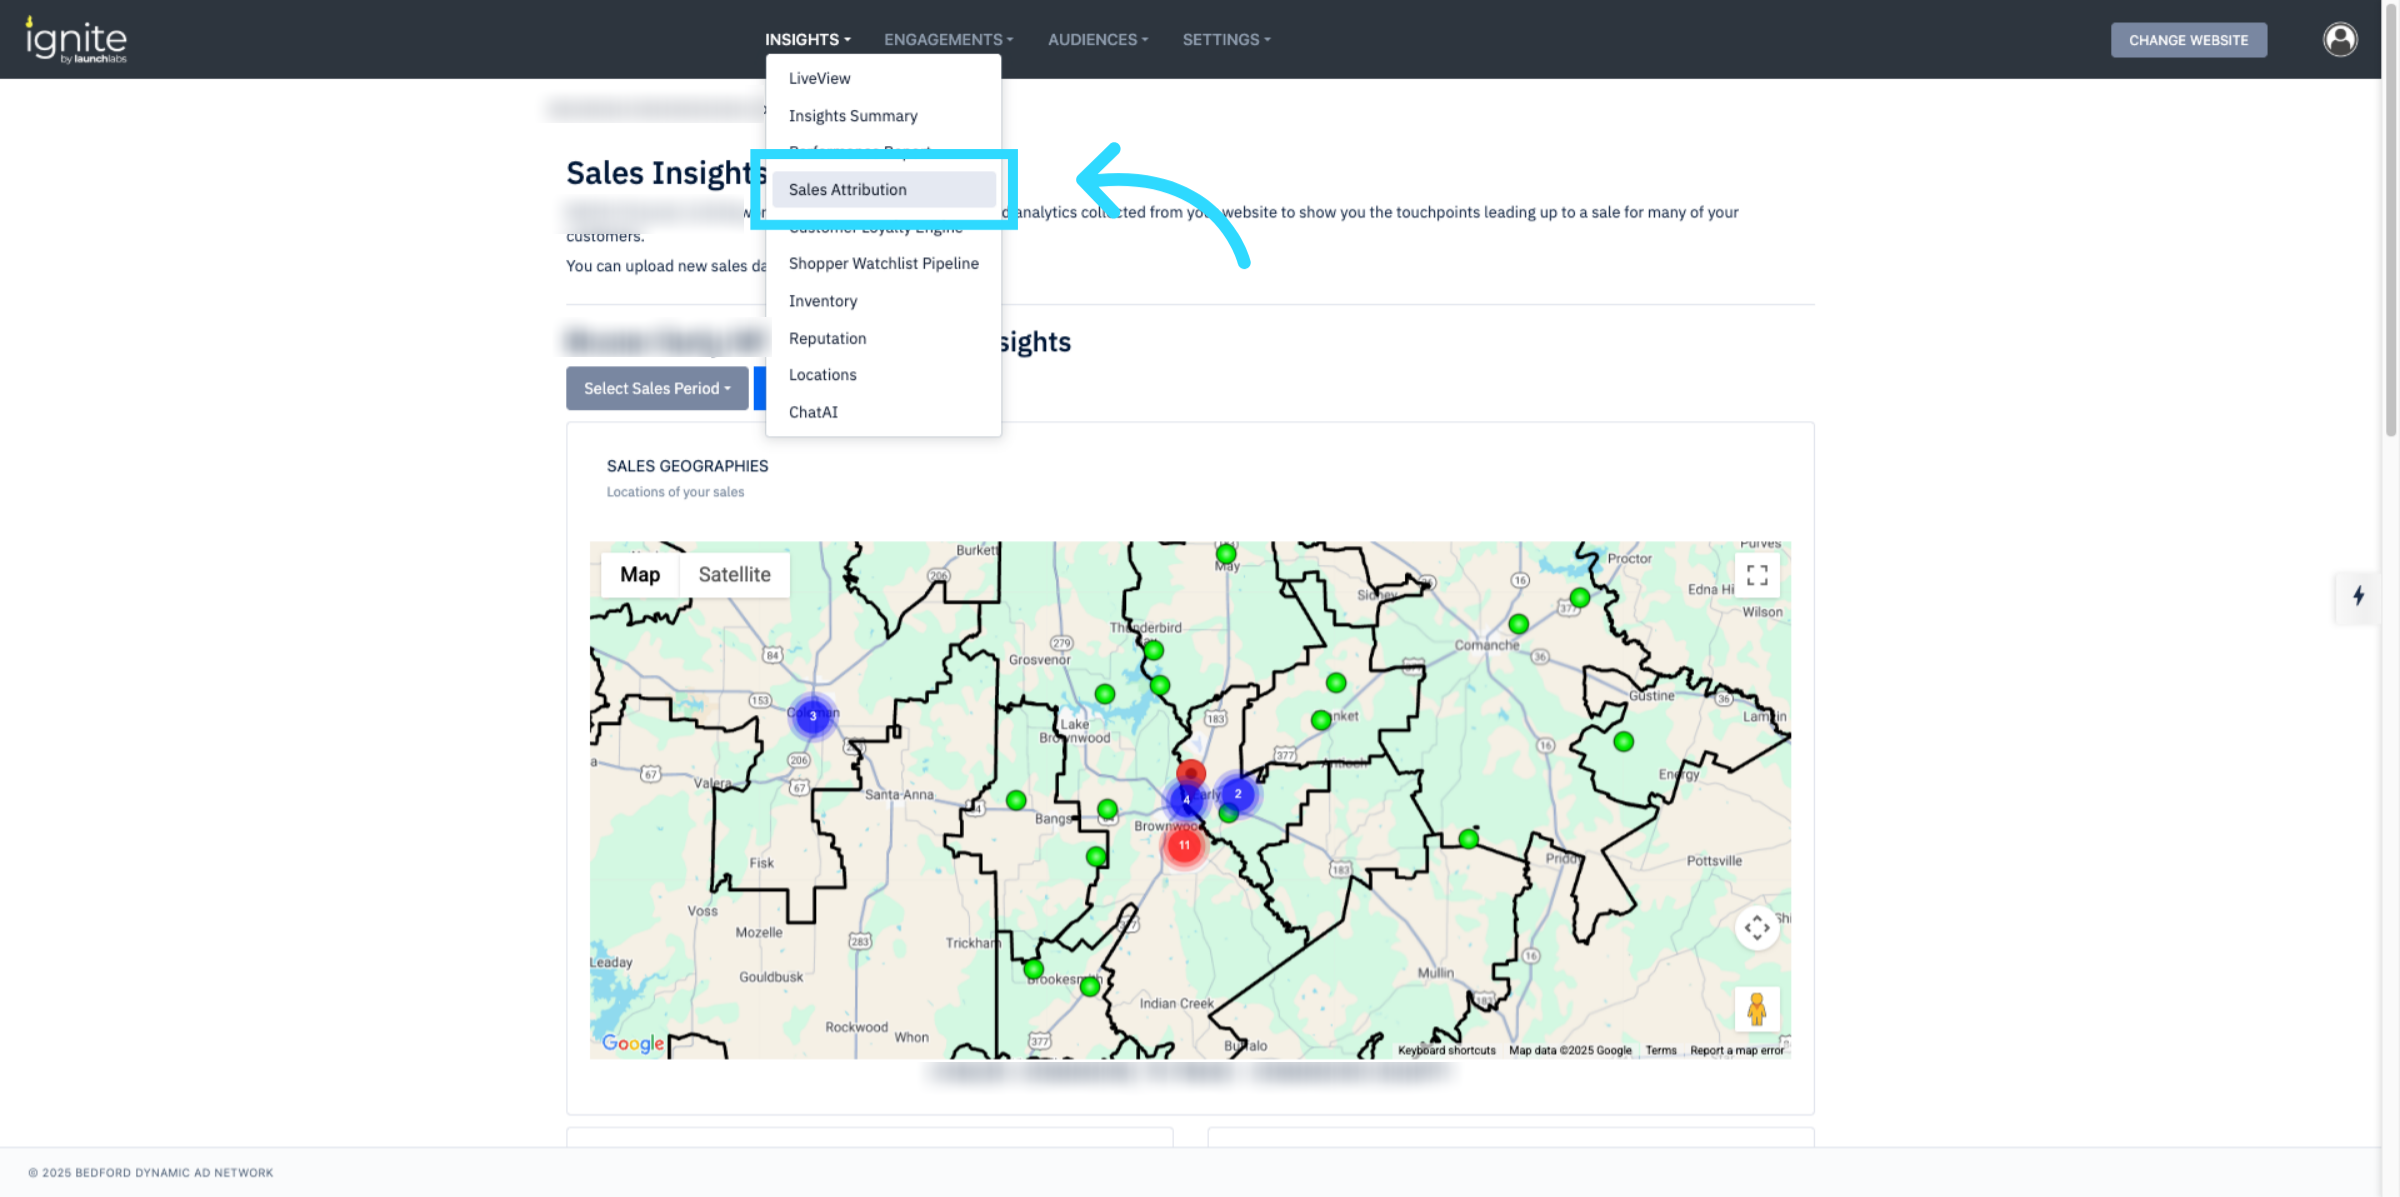
The Sales Attribution Report allows you to connect dealership sales data and match it with website visitor activity. By aligning sold vehicles with shopper behavior, you can measure which offers, campaigns, and digital touchpoints influenced a customer’s decision.
Key Features
Attribution Matching: Automatically matches sales records against shopper activity on your website.
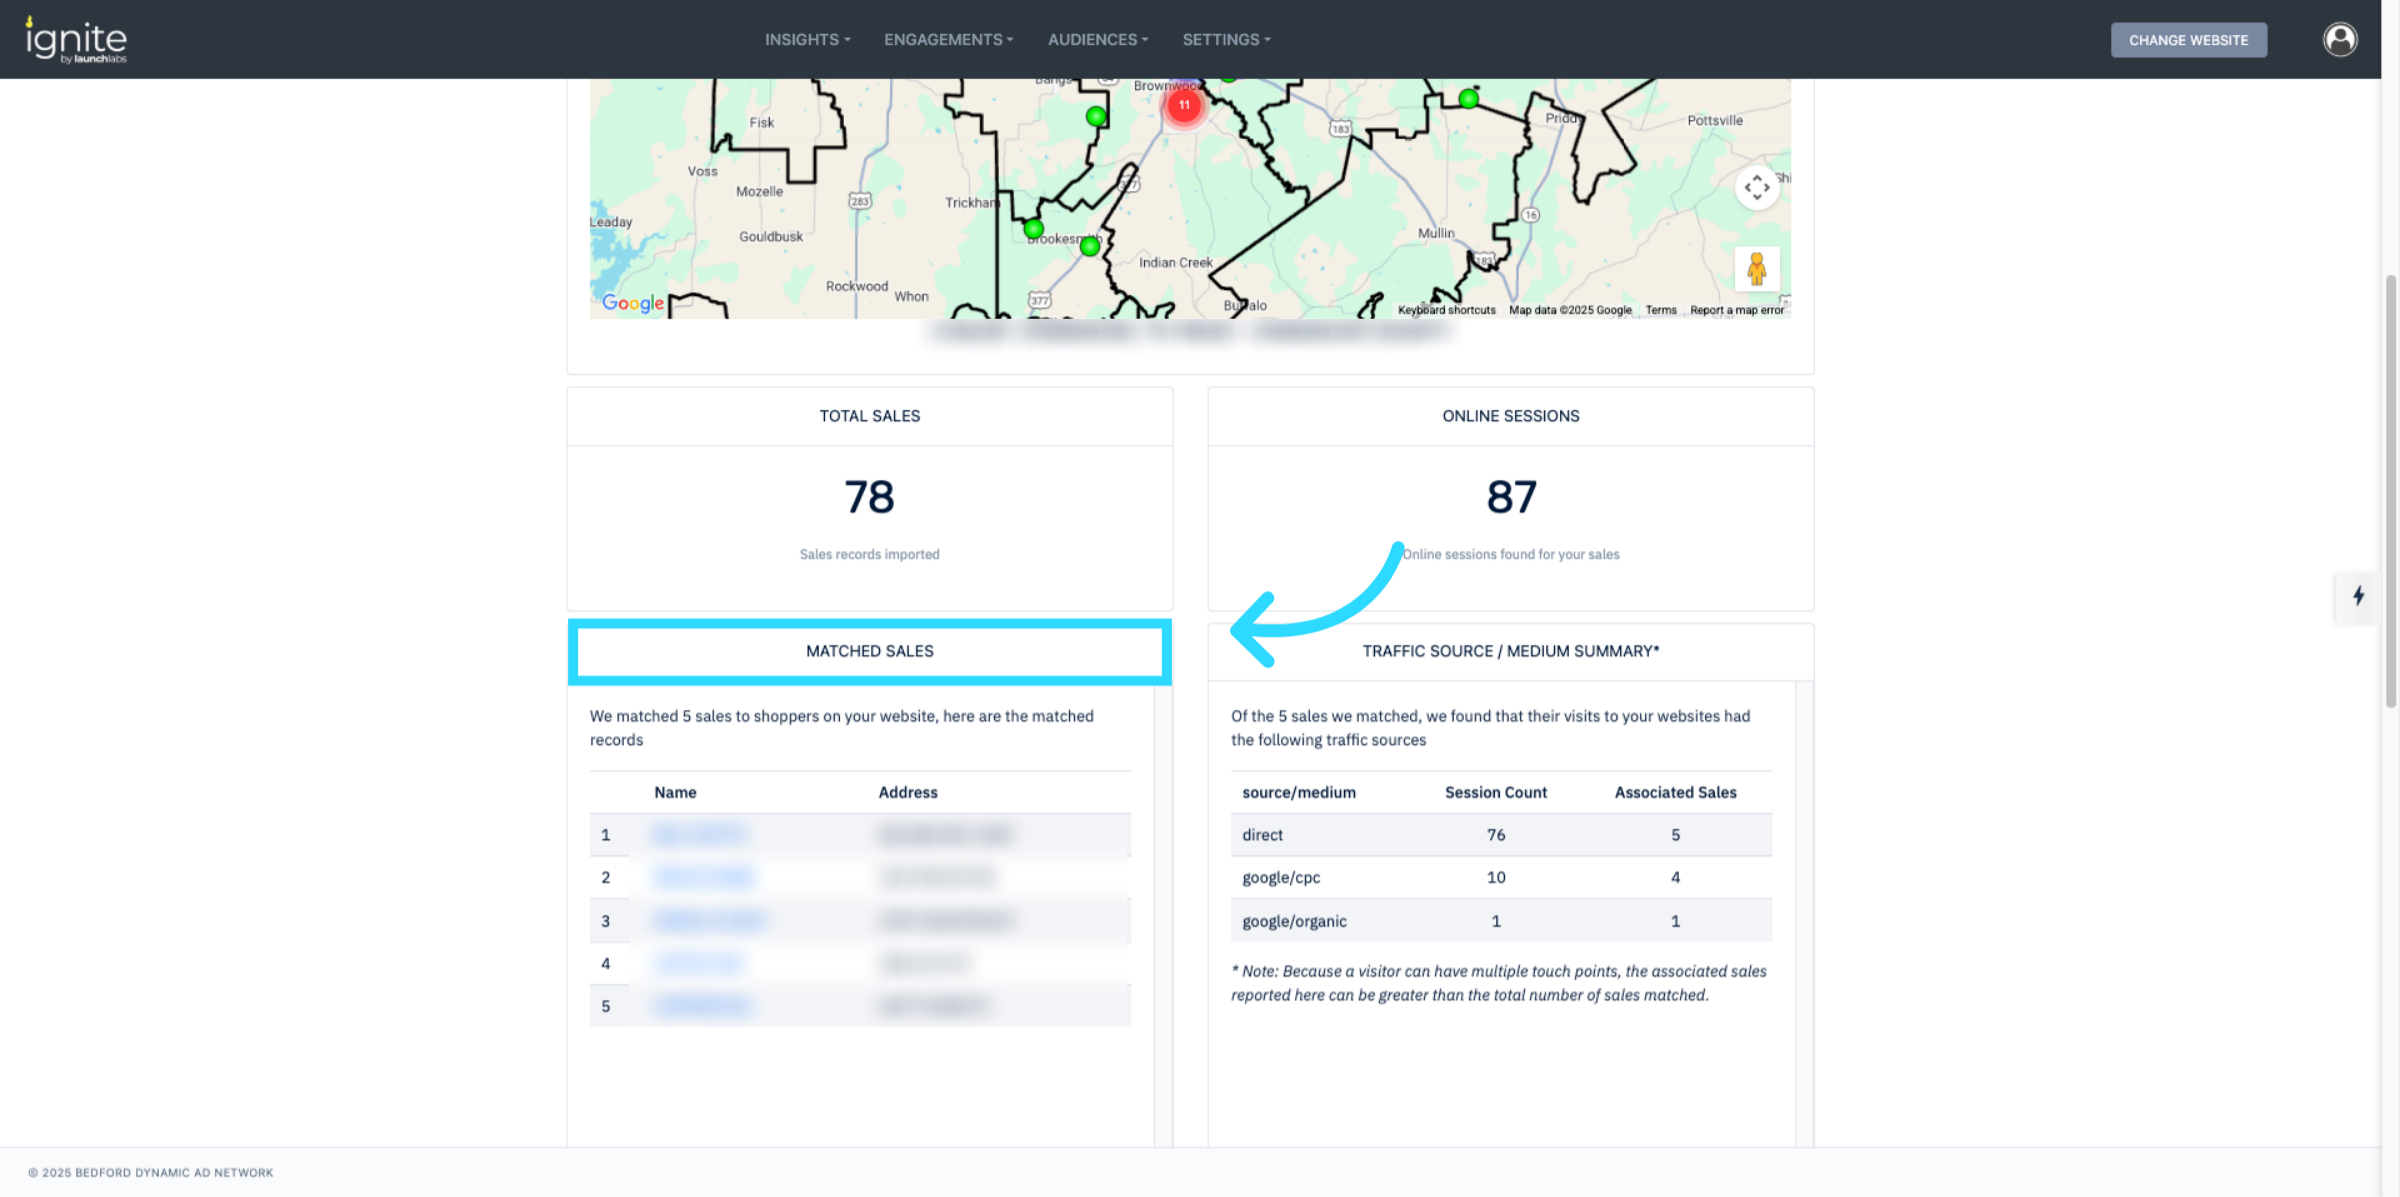
Performance Insights: Provides clear reporting on which offers, campaigns, or audiences contributed to closed sales.
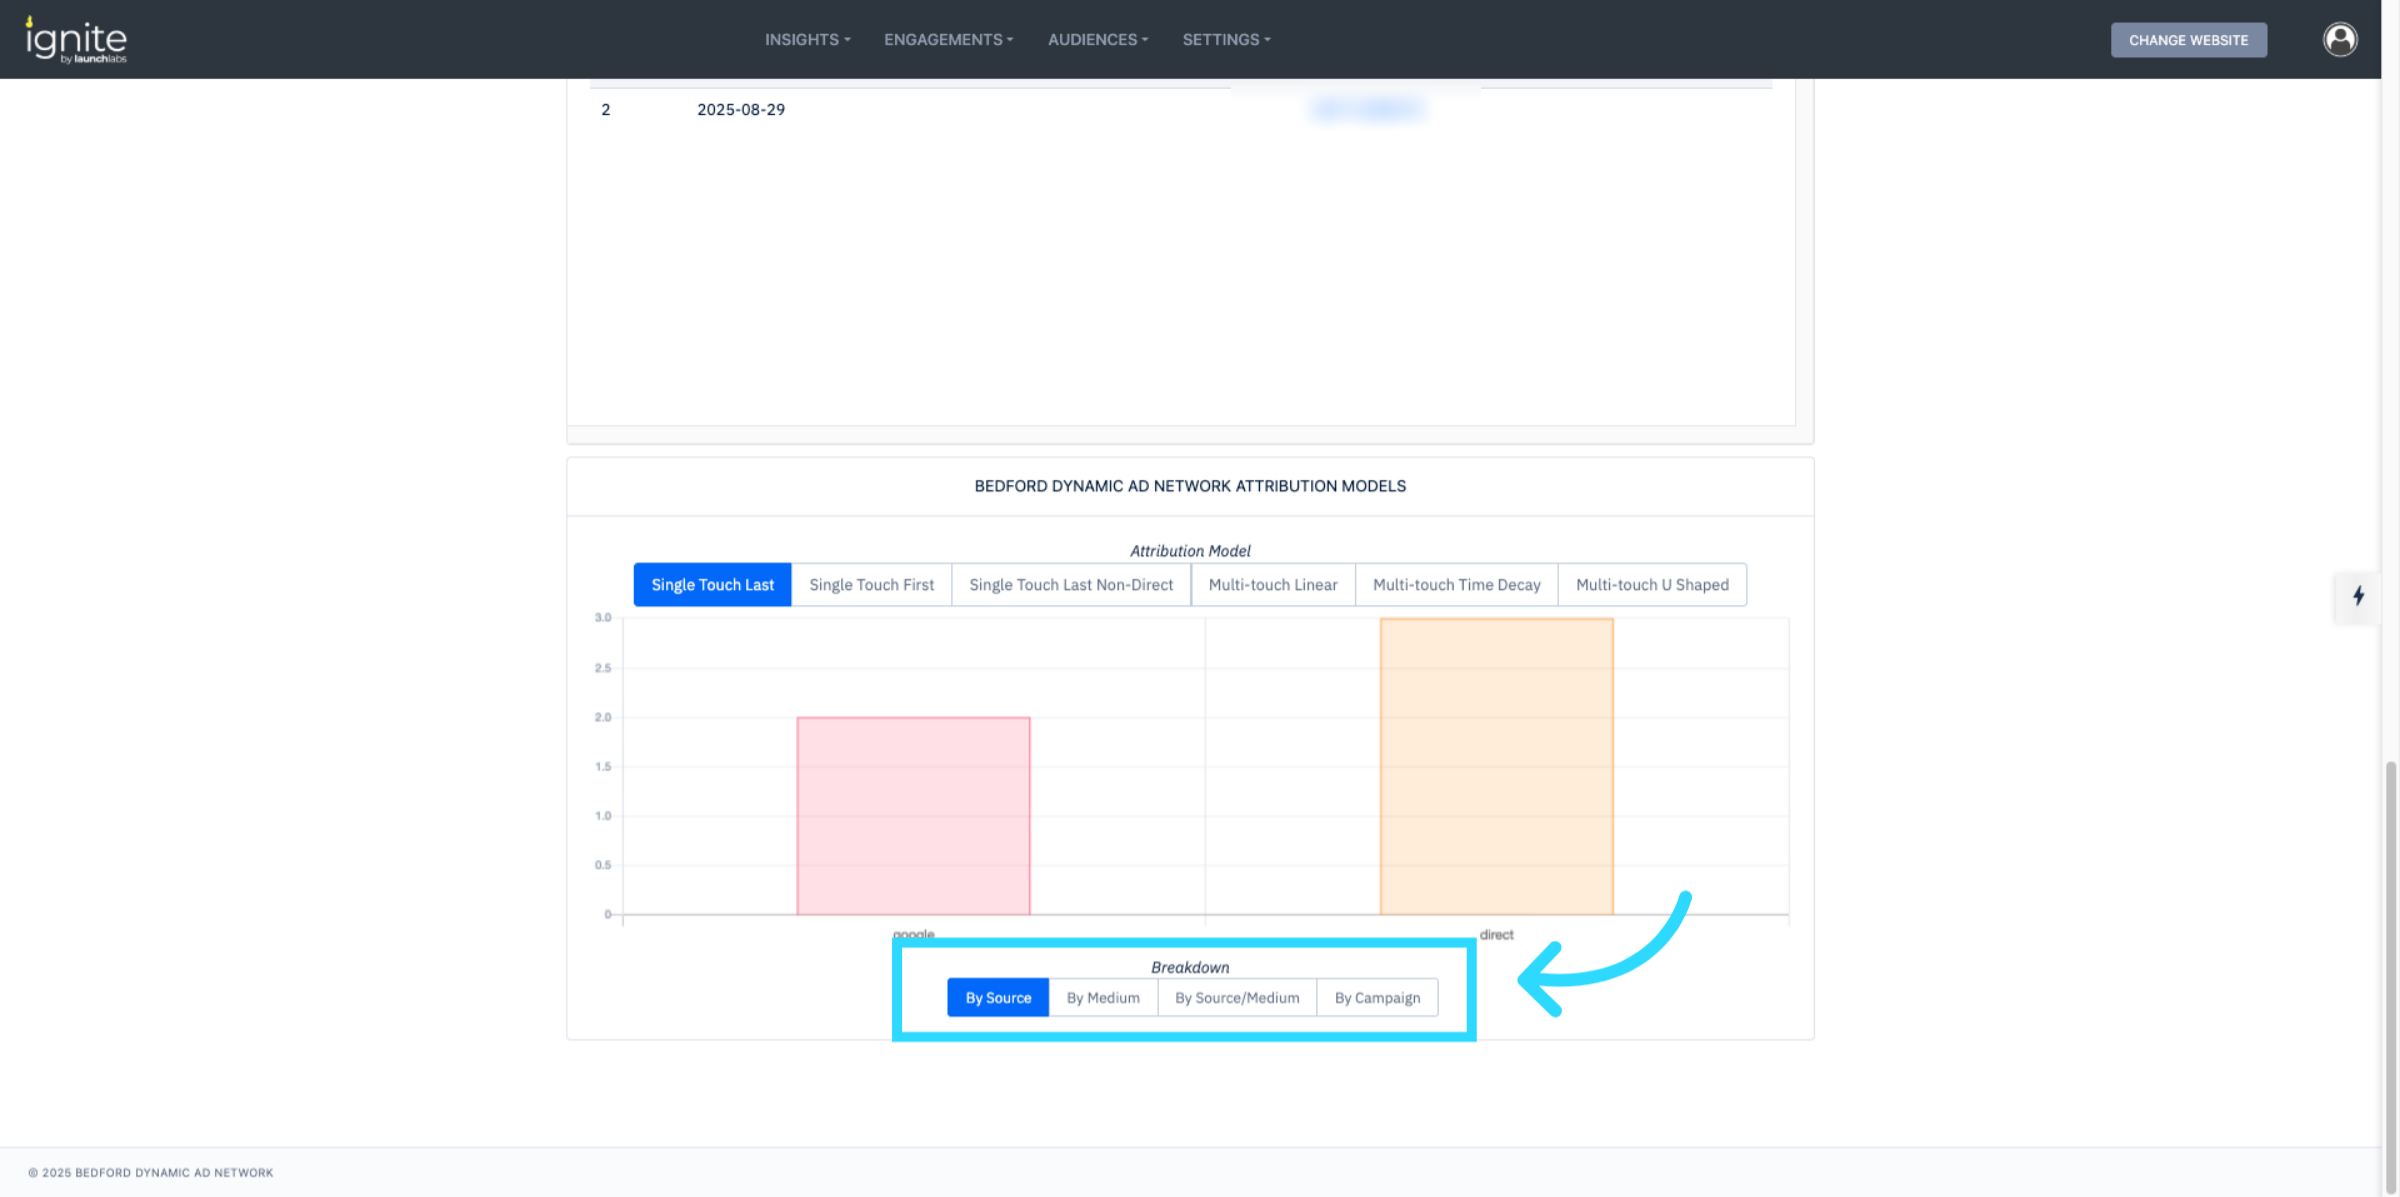
Understanding sales attribution is essential for maximizing your dealership’s marketing impact. By connecting online shopper behavior with actual vehicle sales, you gain a clearer view of which campaigns, offers, and strategies truly drive conversions. This insight enables your team to measure ROI more accurately, focus resources on the most effective marketing efforts, and continuously refine audience targeting and shopper engagement for stronger overall performance.
If you need help uploading or reviewing your data in the Sales Attribution Report, see: How to Upload Sales to the Sales Attribution Report.