What is the Performance Report?
A weekly performance report is a summary of key metrics and highlights from the past 7 days(weekly) and 30 days(monthly), typically including visitor engagement, traffic score, email performance, returning visitors, leads & conversions, and offers.
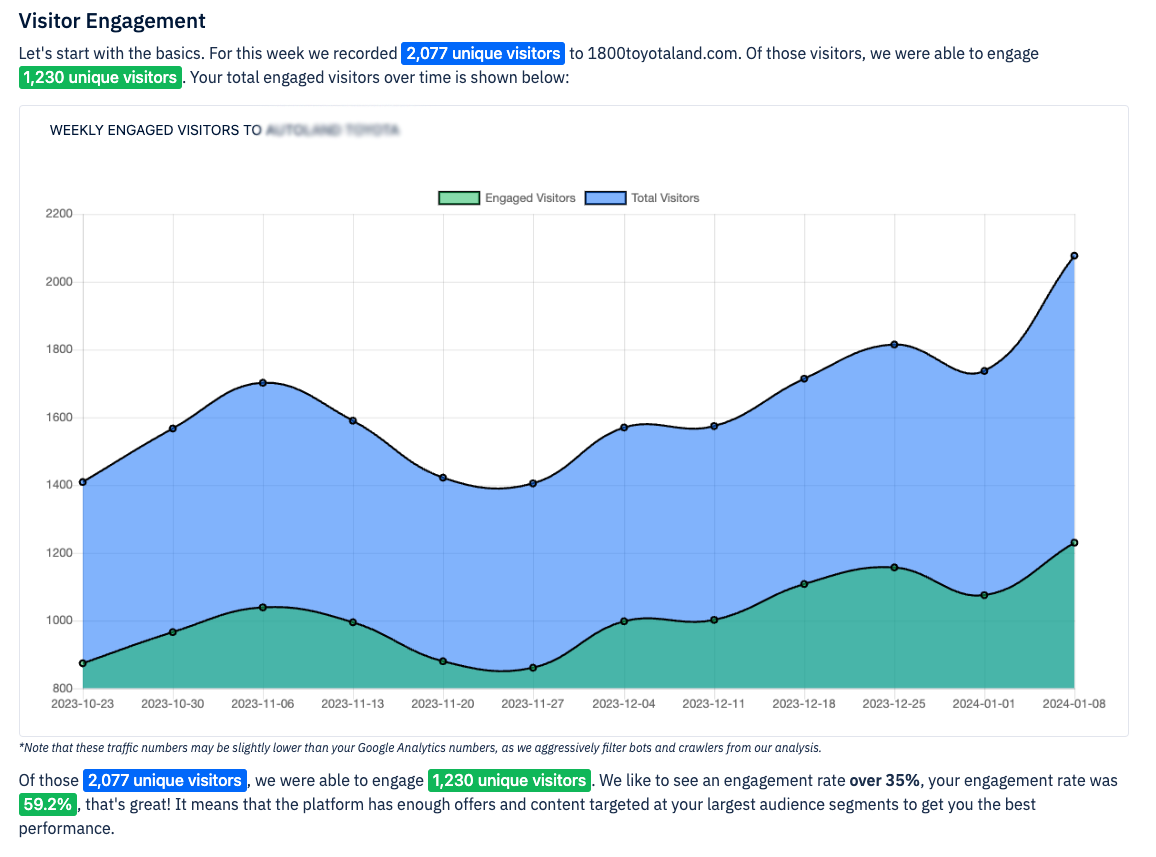
Visitor Engagement: This shows how many visitors were engaged with an onsite message by the platform over the prior 7 day period.
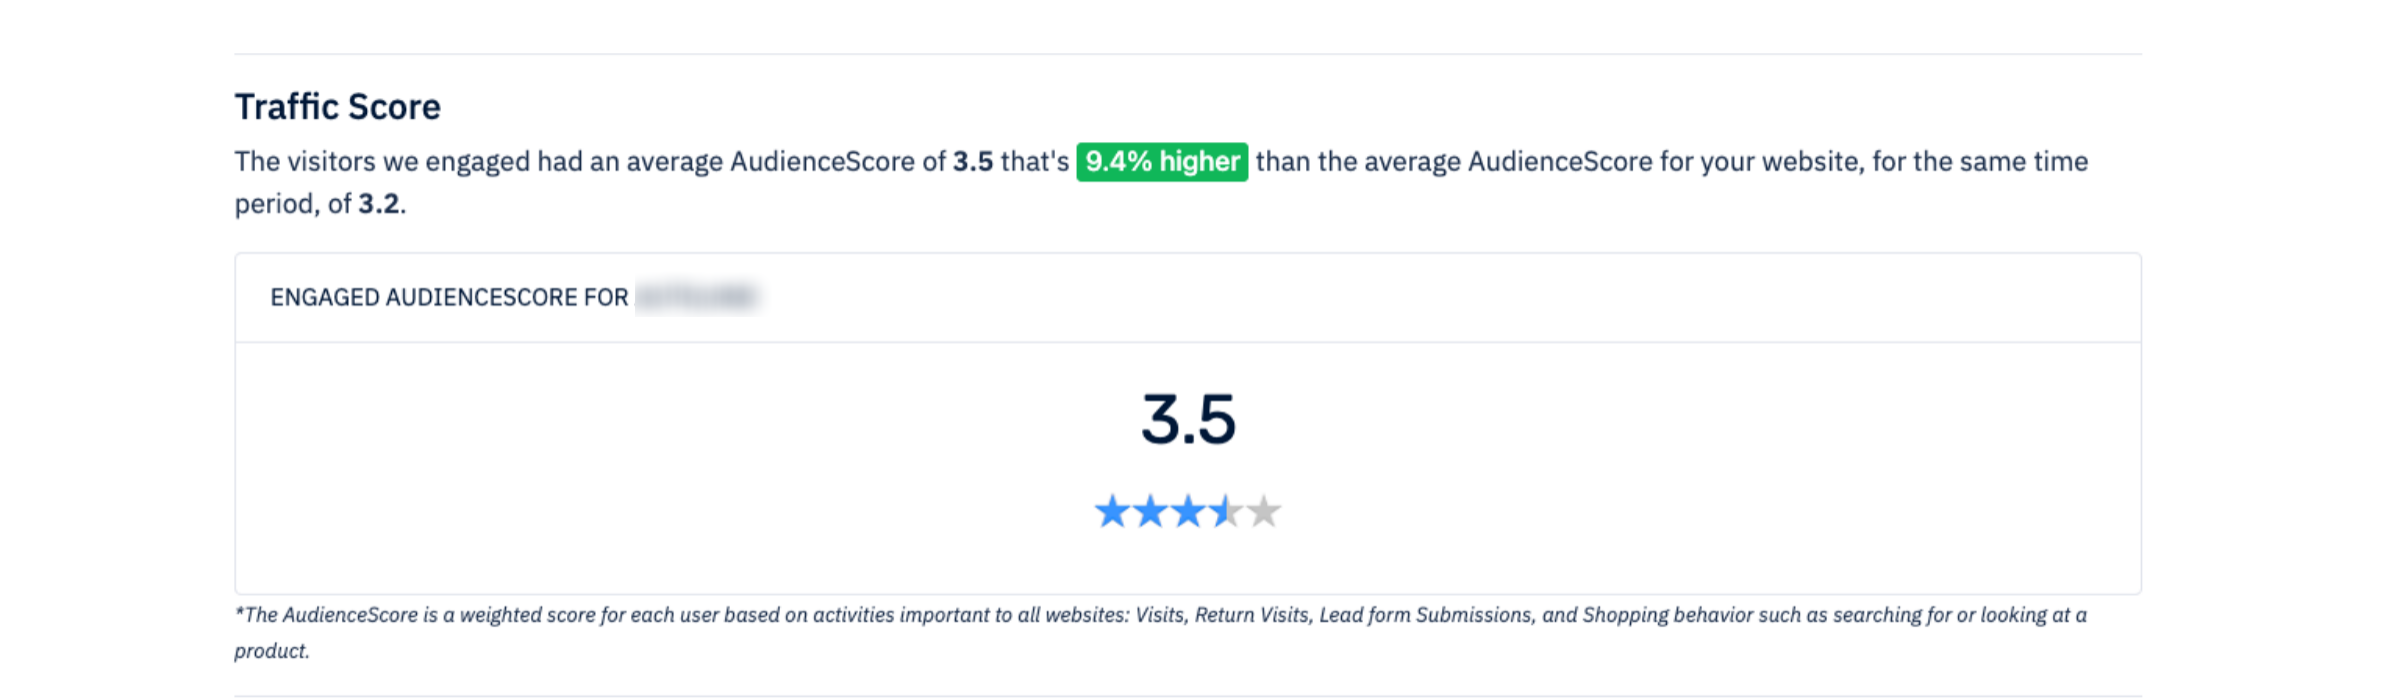
Traffic Score: This show's the "relative" funnel position of the entirety of shoppers that visited the dealer's website. It is not uncommon to see a Star Score of 2 stars. This just means there are a lot of high funnel shoppers entering into their buyer journey mixed with a smaller number of shoppers who are about to purchase their next vehicle.
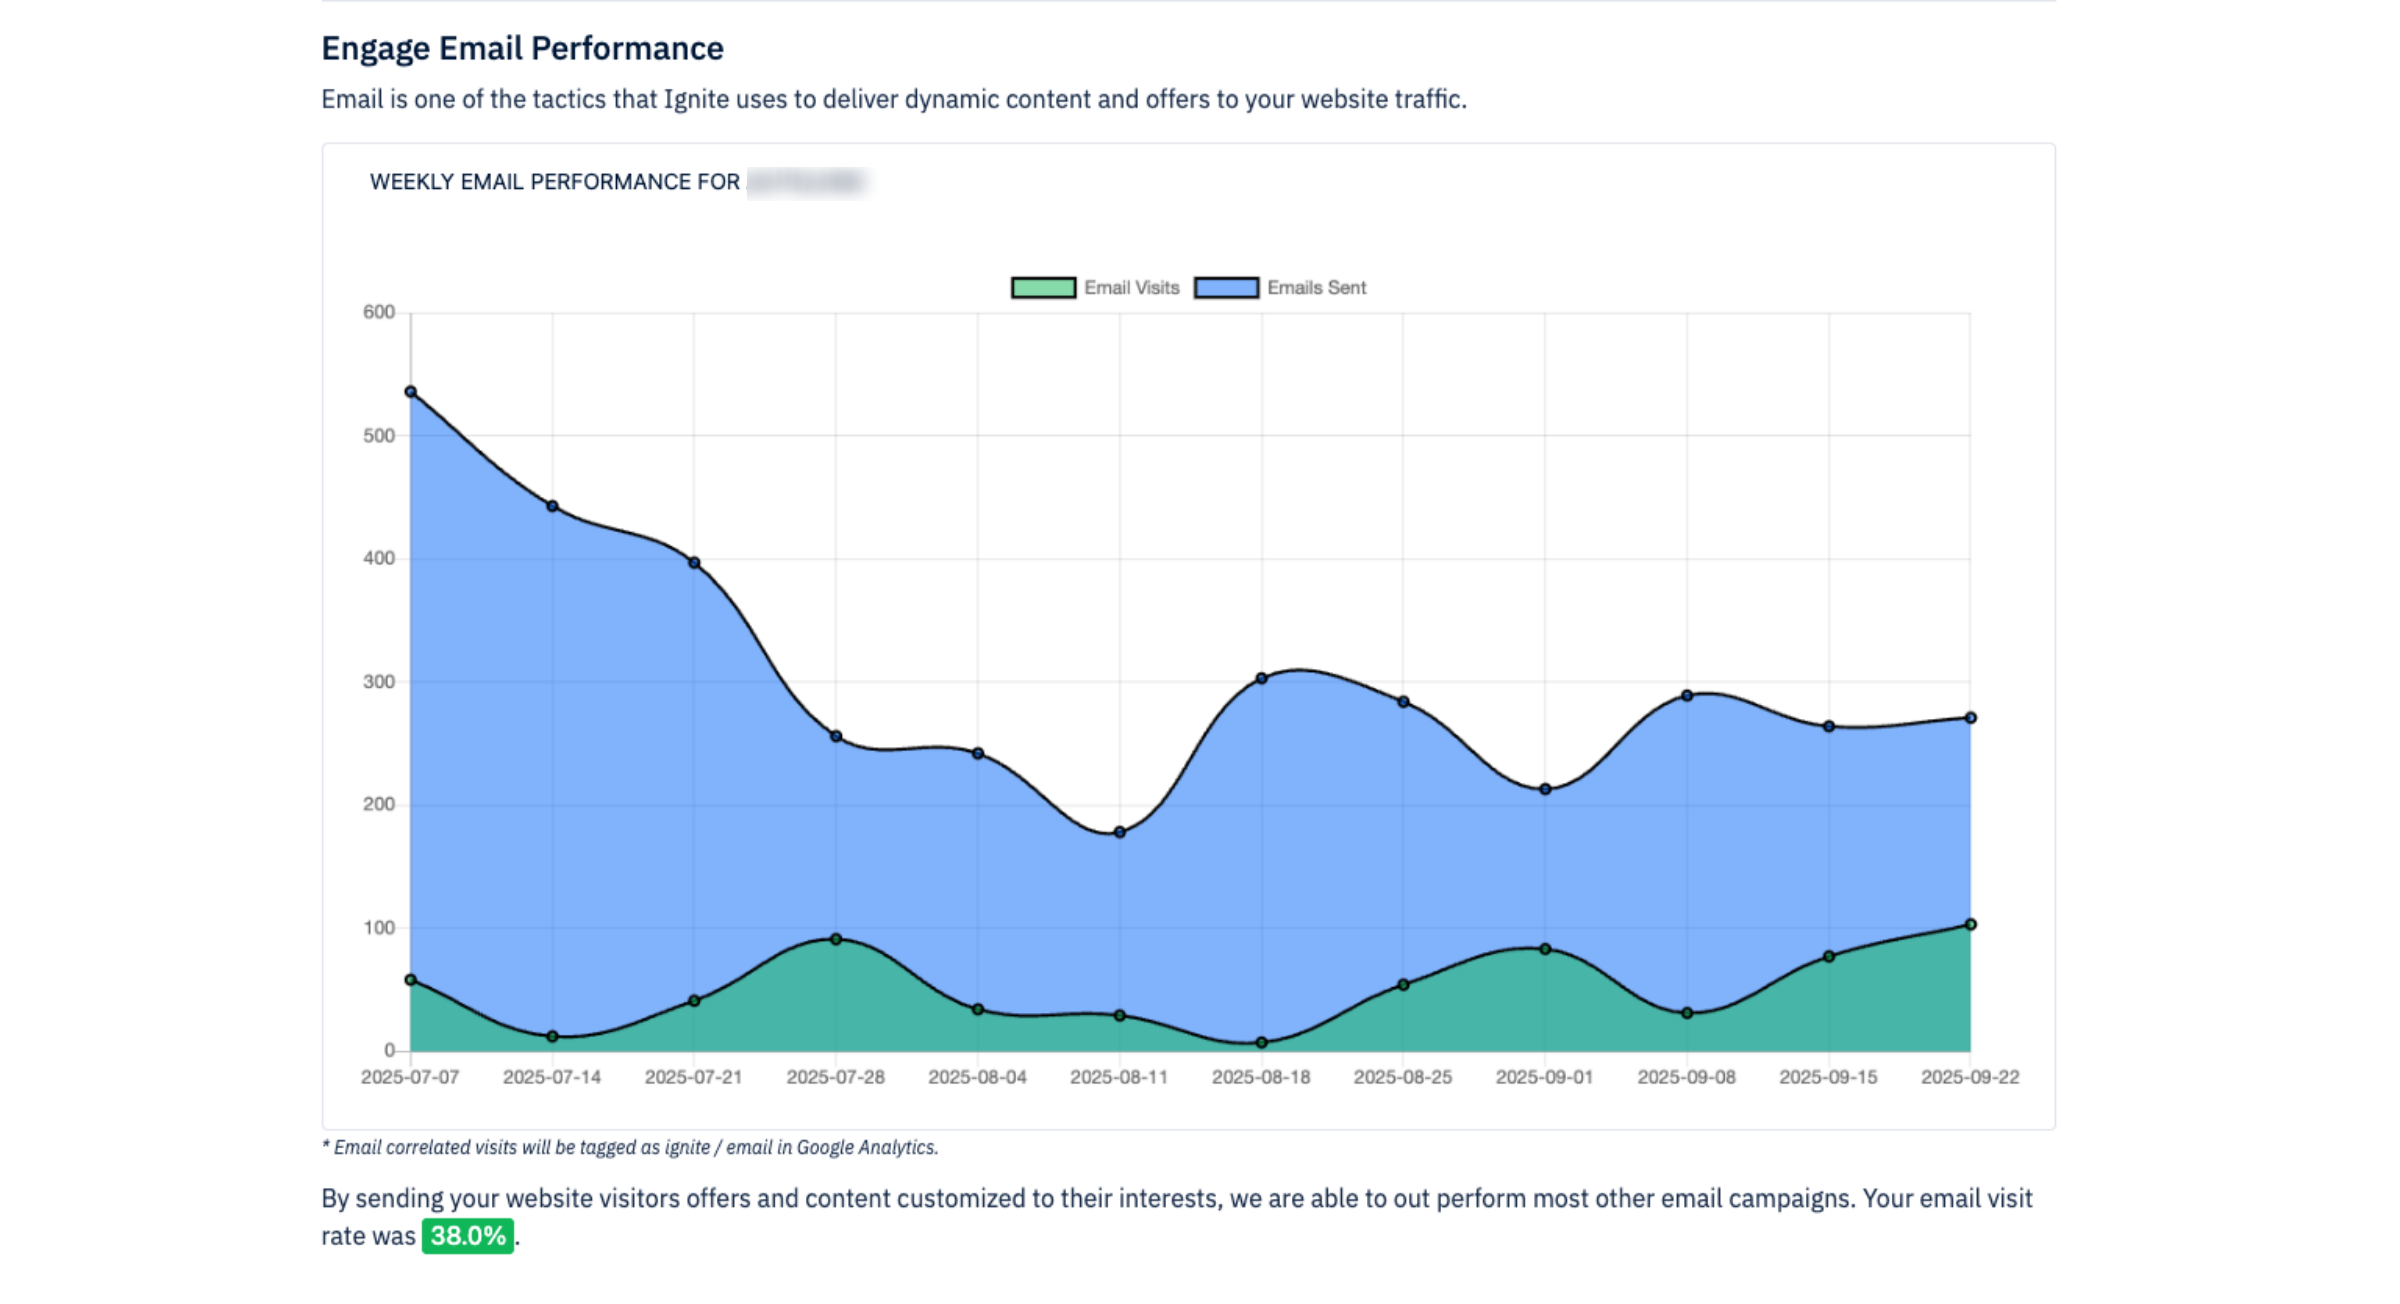
Email Performance: This shows the total number of emails sent and the total number of emails clicked bringing shoppers back to the Dealer's website.
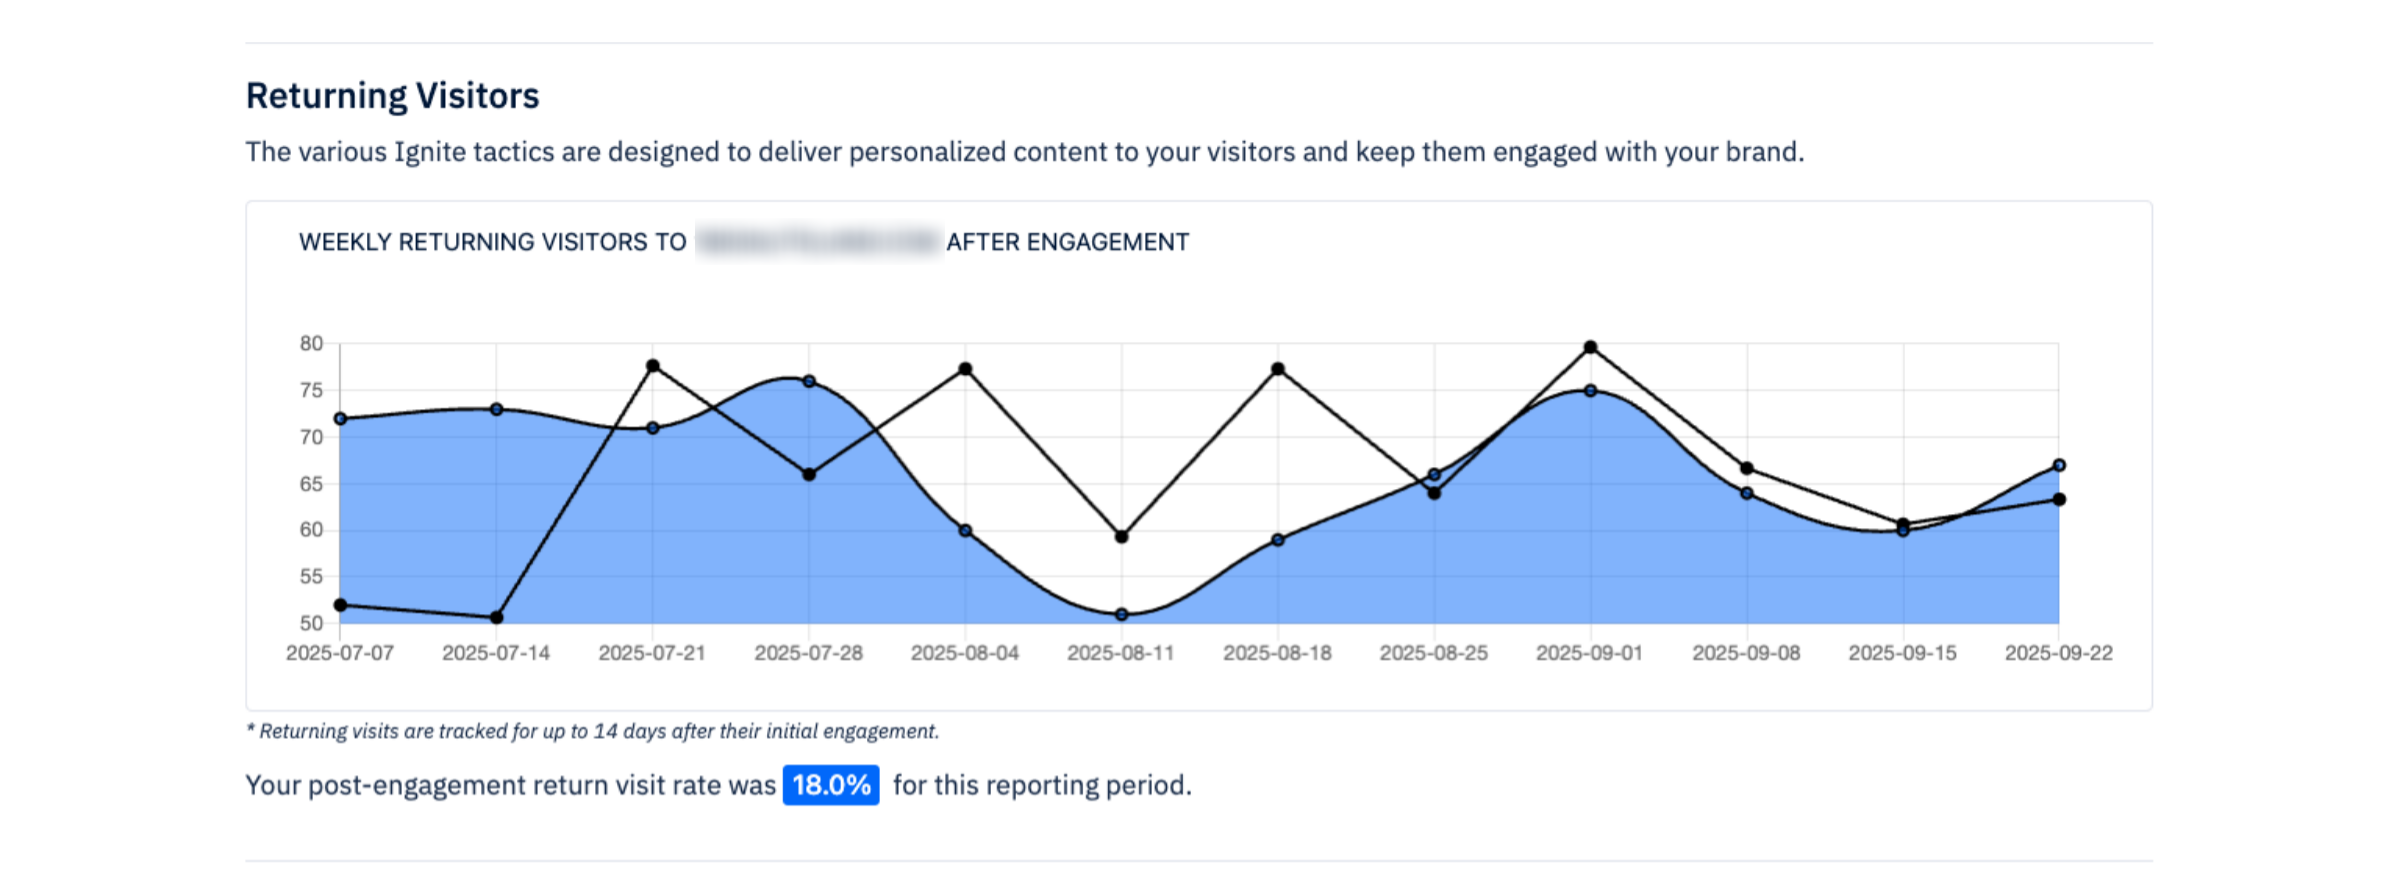
Returning Visitors: This shows the % of shoppers that were engaged in some way by your platform that have subsequently come back to revisit the dealer's website from any source
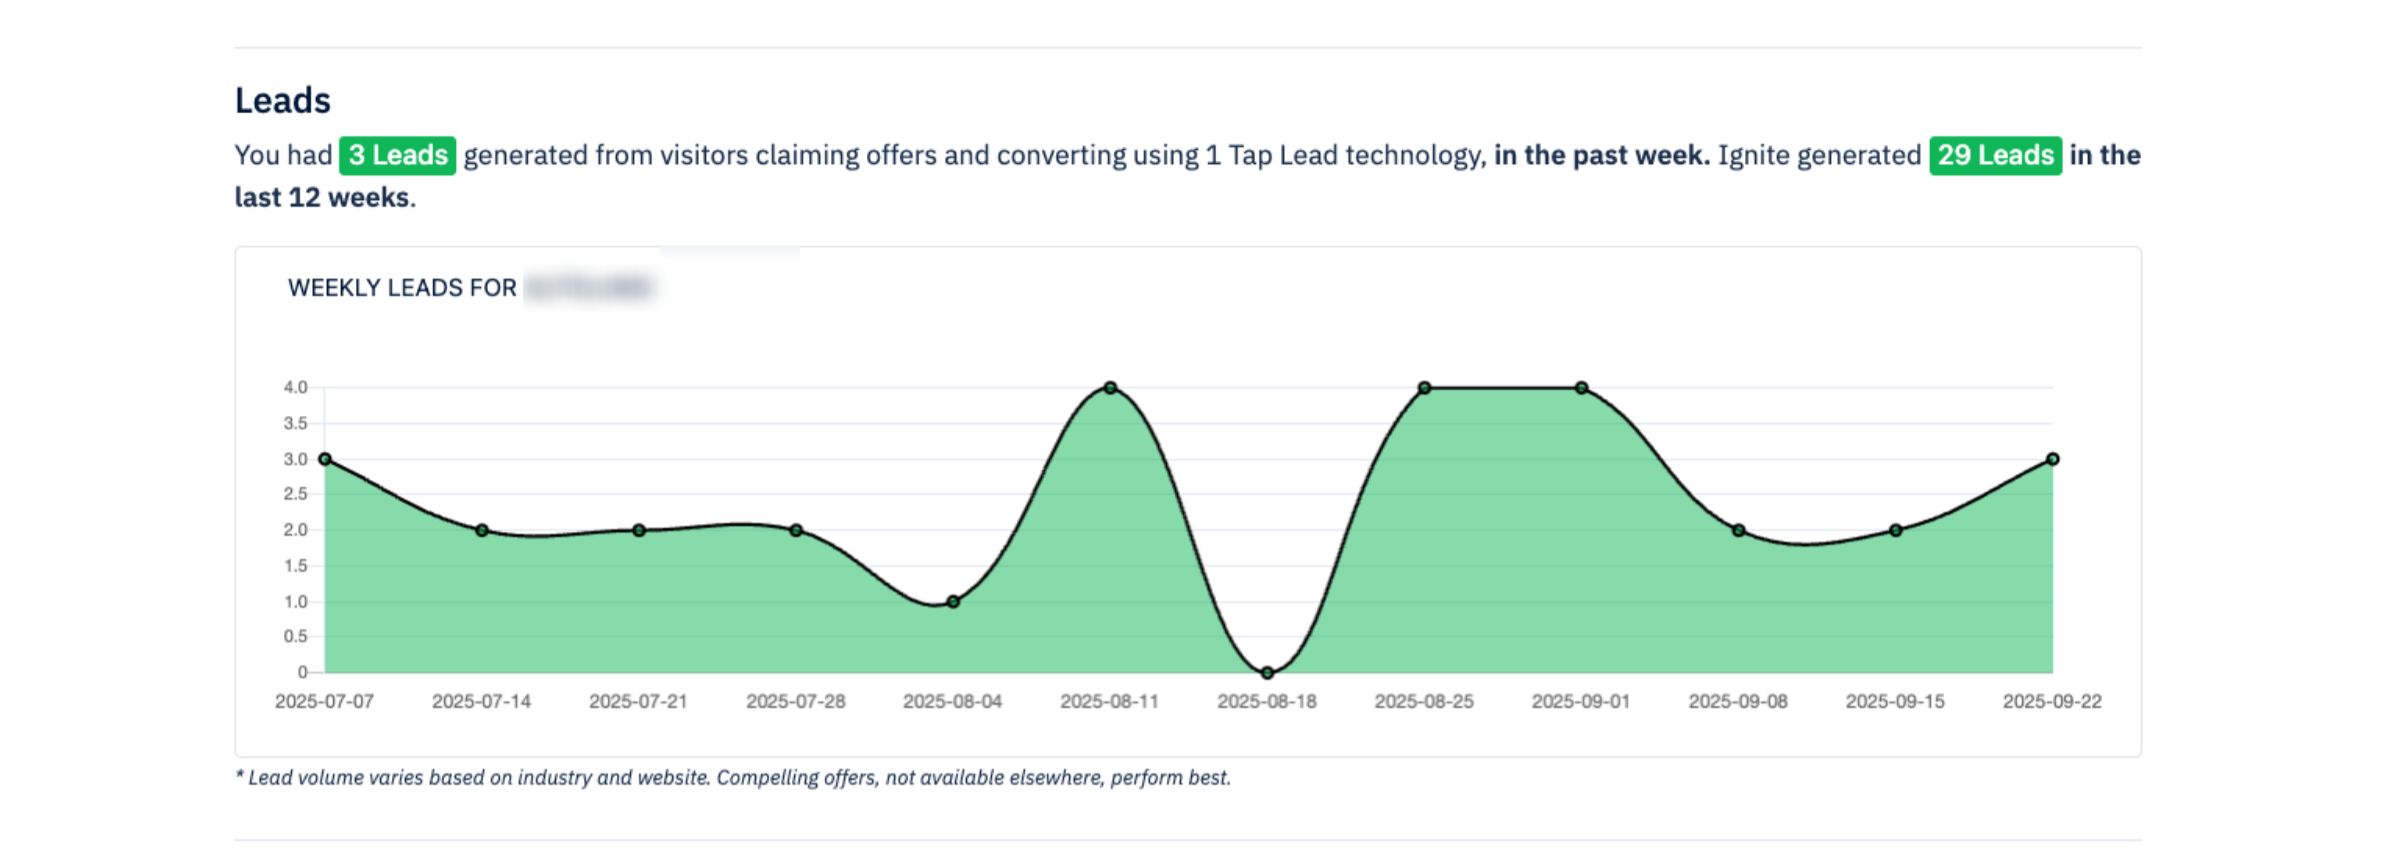
Leads & Conversions: Shows the number of new leads sent to the Dealer's CRM over the last 7 days and a larger total based on historical timeline that is shown
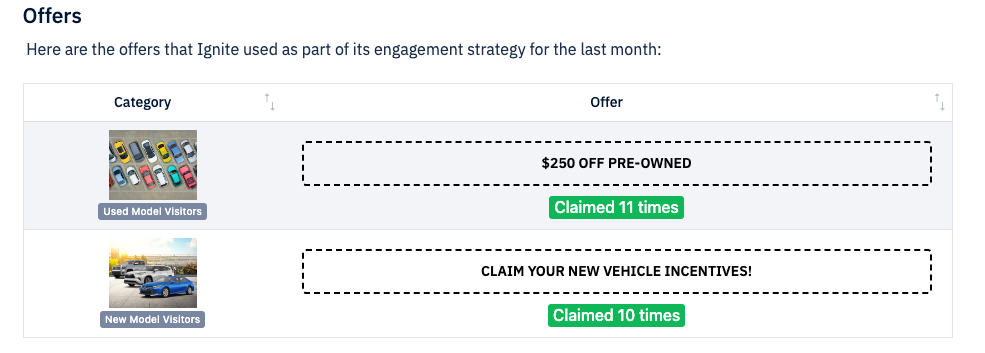
Offers: This shows the offers that have run or are currently running and the number of conversions on each offer