What is the Performance Report?
A performance report is a summary of key metrics and highlights from the past 7 days (weekly) and 30 days (monthly), typically including visitor engagement, traffic score, email performance, returning visitors, leads & conversions, and offers.
Verified Visitor Engagement
This shows how many visitors were engaged with an onsite message by the platform over the prior 7 day or monthly period.

Traffic Score
This show's the "relative" funnel position of the entirety of shoppers that visited the dealer's website. It is not uncommon to see a Star Score of 2 stars. This just means there are a lot of high funnel shoppers entering into their buyer journey mixed with a smaller number of shoppers who are about to purchase their next vehicle.

Email Performance
This shows the total number of emails sent and the total number of emails clicked bringing shoppers back to the Dealer's website.

Returning Verified Visitors
This shows the % of shoppers that were engaged in some way by your platform that have subsequently come back to revisit the dealer's website from any source

Leads & Conversions
Shows the number of new leads sent to the Dealer's CRM over the last 7 days and a larger total based on historical timeline that is shown

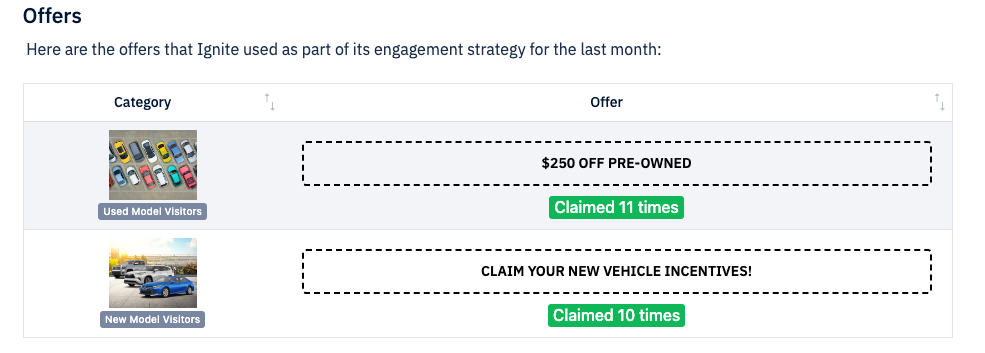
Offers
This shows the offers that have run or are currently running and the number of conversions on each offer
The Team
Under this section, you can see who is receiving the report on a weekly basis. If no one is receiving this report, then this section will not appear. To add people to receive the report, follow the instructions in How to Add Site Contacts.

⚠️ If you would like to change the color for any of the graphs in this report, reach out to an Account Executive